16. Overview — analytics dashboard
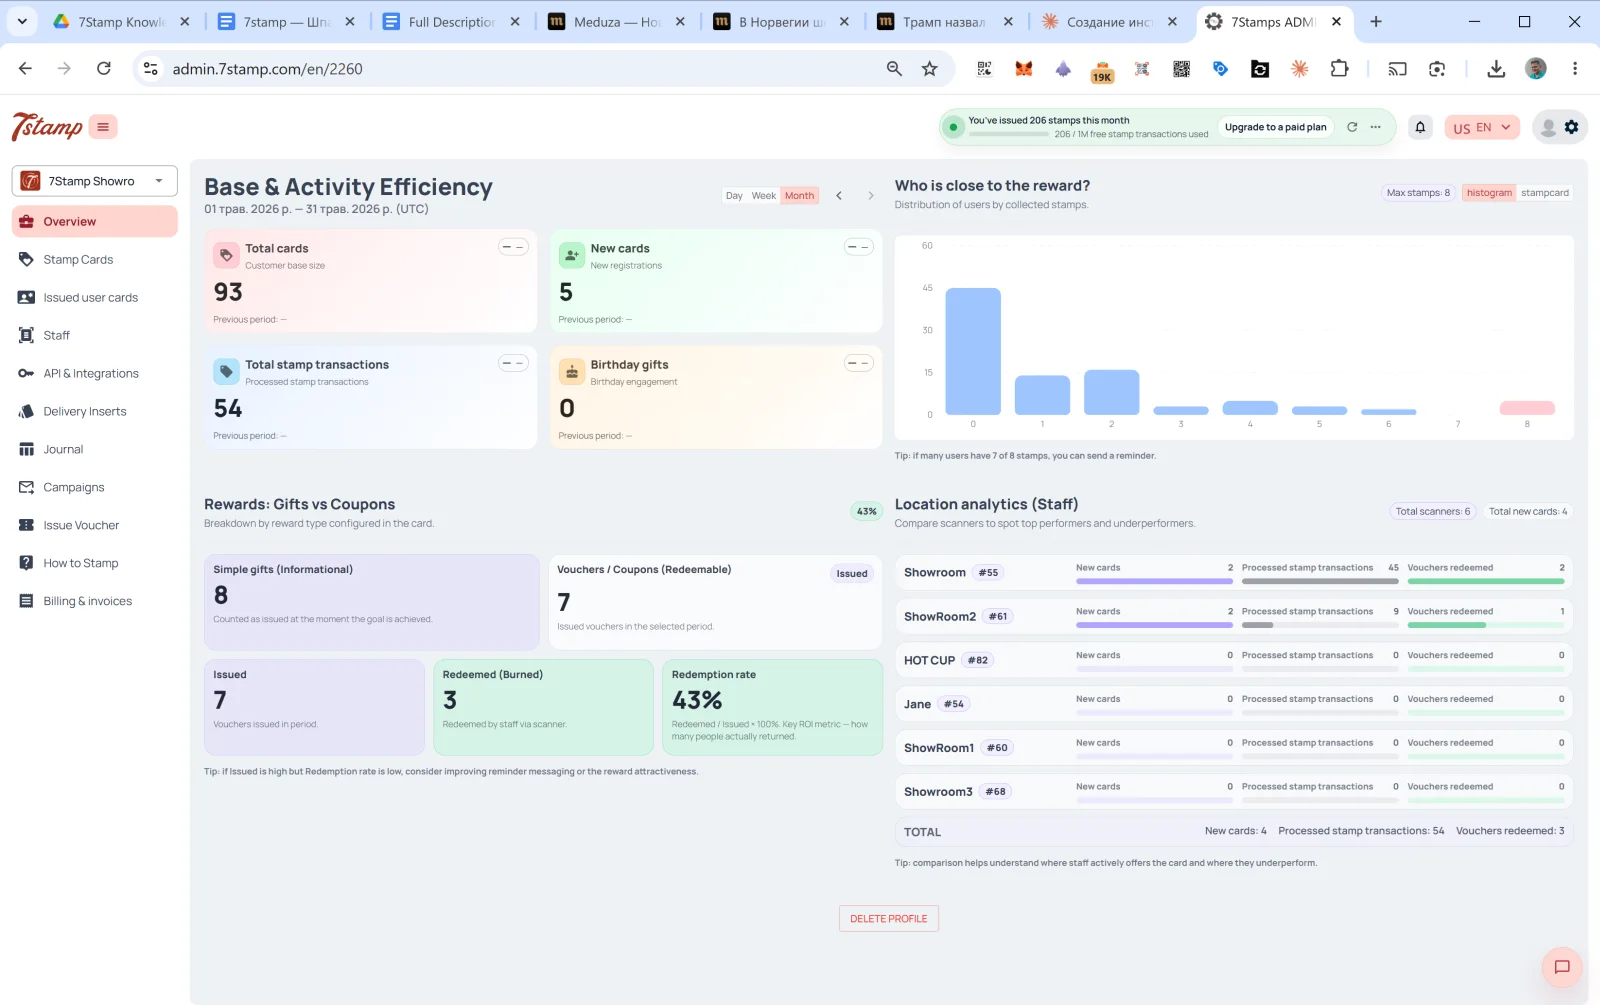
Overview is the main page of the admin, the first thing you see after login. A four-section dashboard.
16.1 Base & Activity Efficiency
Base activity for the chosen period. Switch in the upper right: Day / Week / Month (default Month), arrows ← → to navigate periods.
Four cards:
- Total cards — total customer base (Customer base size).
- New cards — new registrations in the period (New registrations).
- Total stamp transactions — processed stamp transactions.
- Birthday gifts — Birthday engagement (issued birthday gifts).
Each card has a previous-period comparison (Previous period: — if there’s no data).
16.2 Who is close to the reward?
A histogram of customer distribution by collected stamps. The X axis is the stamp count (0, 1, 2, …, Max), the Y axis is the number of customers at that level.
The hint below: “if many users have 7 of 8 stamps, you can send a reminder.” — this is the tool for finding hot segments: customers who need 1–2 more stamps are most likely to return if reminded.
16.3 Rewards: Gifts vs Coupons
A split by issued Reward type (Breakdown by reward type configured in the card):
- Simple gifts (Informational) — count of issued Awards (instant gifts that don’t require redemption).
- Vouchers / Coupons (Redeemable) — count of issued vouchers. Of which:
- Issued — issued.
- Redeemed (Burned) — redeemed by staff via the scanner.
- Redemption rate —
Redeemed / Issued × 100%. The main ROI metric — it shows how many customers actually returned and used the gift.
The hint below: “if Issued is high but Redemption rate is low, consider improving reminder messaging or the reward attractiveness.” — if you issue many but redeem few, the problem is either in the reminders or in the attractiveness of the gift.
16.4 Location analytics (Staff)
Staff / location performance comparison. At the top — Total scanners and Total new cards counters.
For each Staff:
- Name +
#ID. - New cards — how many new customers this staff brought in the period.
- Processed stamp transactions — how many stamps were added.
- Vouchers redeemed — how many vouchers were redeemed.
At the bottom — TOTAL across all staff.
Hint: “comparison helps understand where staff actively offers the card and where they underperform.”
This block is a critical management tool. If Showroom1 has 45 stamps in a month and HOT CUP has 0, that’s a signal: either the staff isn’t offering the card to customers, or they have a technical scanner problem. Worth folding into shift KPIs.
Visual walkthrough
Use the screen sets below as a visual companion to the article. Open any image to inspect it at full size.